PRTG Network Monitor 17.3.33.2753 Stable Multilingual + Full PRTG Manual
This post was published 5 years ago. Download links are most likely obsolete. If that's the case, try asking the uploader to re-upload.
File Size: 236.5 Mb
PRTG Network Monitor is a useful monitoring tool designed to retrieve information from multiple sensors and send notifications to the responsible network administrators. Its purpose is to provide you with real-time information in order to easily identify and solve problems.
Network administrators have the permanent need to know what is happening with various devices from their networks. Whether they want to view the bandwidth usage or the availability of a certain resource, this program has the right tools for the job.
In order to receive updated info, you have to run the program and configure the desired sensors. It automatically detects the network interfaces and allows you to select from a wide range of sensors in order to retrieve the required data.
When adding a new alert a wizard guides you through the required steps and allows you to filter the available tools by using the target system type or the used technology. Thus, you can check the CPU usage on a Windows machine or check the number of messages from an email server.
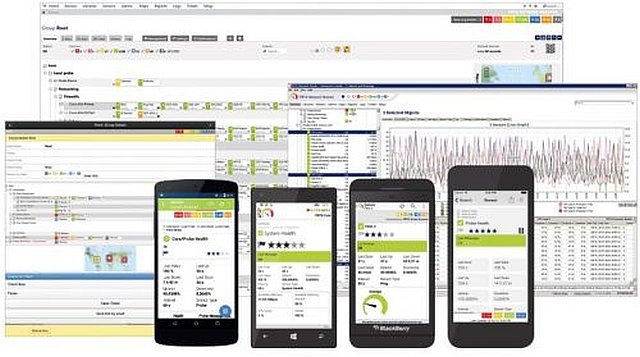
The interface is available in any Internet browser and provides quick access to the sensors, alarms and reports. Additionally, you have the option to create network maps which enable you to access a certain device or probe from a complex network.
Since the main goal of the application is to provide information, it comes with multiple report templates and is able to generate and schedule additional reports. The retrieved information can be displayed in the browser, exported to a PDF file or sent to an email address.
One of the advantages of this tool is the variety of resources that can be monitored. The list includes database servers, file servers, computers, virtual machines and multiple operating systems.
If you need stay in touch with the devices from your network, the PRTG Network Monitor is a versatile tool with advanced reporting features. It also includes an extensive documentation and video tutorials which recommends it for all user categories.
FEATURES
Installation & Usability:
• Automatic Network discovery
• Preconfigured device templates with recommended sets of sensors for various devices
• Highly interactive and customizable Interface for optimized usability
• Configuration is arranged in a tree-like hierarchy with inheritance of settings
Architecture & Performance:
• Modern, powerful software engine
• Scales up to several 10,000 sensors for one installation
• Allows load distribution using remote probes for CPU-intense monitoring like e.g. packet sniffing
Network Monitoring Features:
• "Smart" sensors that e.g. automatically discover quad-core CPUs and and monitor them individually as well as the total CPU load
User Interface:
• The integrated Webserver supports SSL security, multiple logins, user groups and an HTTP-based API for interfacing with other applications
• Monitoring results are viewable in various perspectives
• User can create "Maps" which bring together monitoring status, graphs and tables in customizable layouts and with customizable backgrounds like network charts
New in version 17.3.33
• [Sensors] 8 brand new sensor types for your NetApp cDOT or ONTAP storage system: NetApp Aggregate, NetApp I/O, NetApp LIF, NetApp Physical Disk, NetApp System Health, NetApp Volume, NetApp LUN, NetApp NIC. They replace the existing NetApp cDOT sensors.
• [Sensors] The new REST Custom sensor queries a REST endpoint and transforms the returned JSON or XML to a sensor response based on a transformation rule. Specify this rule as a JSON file according to the PRTG API specification for custom sensors.
• Various fixes and improvements
New in version 17.3.33.2753 Stable
Fixed:
• WebGUI: Fixed memory leak in the PRTG web interface
SYSTEM REQUIREMENTS
• 64 MB RAM (128 MB and more recommended)
• between 25kb and 300kb disk space per sensor per day for the monitoring data database
• TCP/IP Network Connection
• MICROSOFT .NET FRAMEWORK 4.0 / 4.5
• Internet browser
• Windows Server 2012 R2, Windows Server 2016, Windows 8.1 Pro, Windows 10 Pro (32/64-bit)
Languages: English, German, Spanish, French, Portuguese, Dutch, Czech, Japanese, Russian and Simplified Chinese
Homepage
Download from free file storage
Resolve the captcha to access the links!
Registered members don't get captcha ... just sayin