Swing Trading Strategy

Published 1/2023
MP4 | Video: h264, 1280x720 | Audio: AAC, 44.1 KHz
Language: English | Size: 478.40 MB | Duration: 0h 39m
Identifying entry and exit from the chart
What you'll learn
Trade the chart
knowledge of technical indicators the most important and how it works
Draw the horizontal and trendline resistance and support
Find stocks with mentioned criteria
Requirements
Finance students and traders
Description
this course explain the strategy of trading based on the chart as well the technical indicators most used in the swing trade. it also explain about the difference between the fundamental analysis and technical analysis for companies. this course include as well the pattern associated on the charts with the trend related as well the risk management taken with every trade.Learning about the difference between direct offering and public offering and how it affects the price of the stocks.Learning all technical indicators and how to set on the chart and how to use it in details.The course include a brief knowledge for the short sell with the risk associated. Also the course teach how to draw the support and the resistance on the chart as well how to find stock bottomed with a big potential of reversal .Difference between swing trade and long investment and how to search a stock with great long term value.This course include video examples and practice for every lessons explained with the tools for enhance skills in trading .Defining the bullish divergence and the bearish divergence between the chart price and other indicators as well defining indicators used in daytrade like VWAP and EMA .
Overview
Section 1: Introduction
Lecture 1 Introduction
Section 2: Support and Resistance
Lecture 2 Defining an horizontal support and resistance
Lecture 3 Trendline support and Resistance
Lecture 4 Dynamic support and resistance
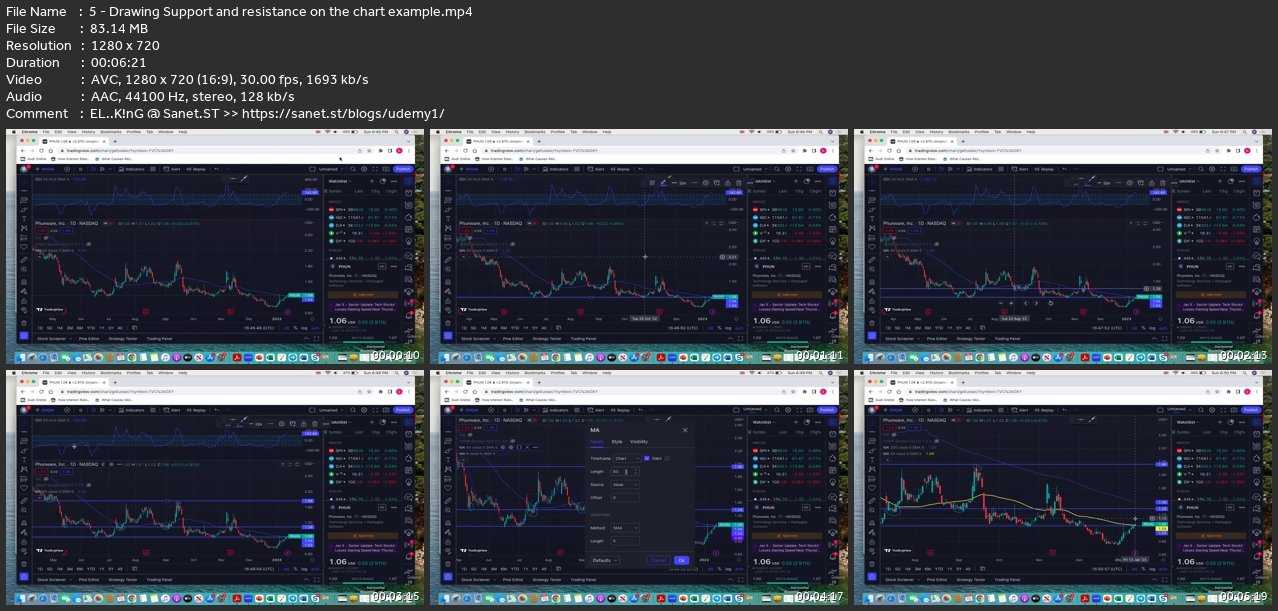
Lecture 5 Drawing Support and resistance on the chart example
Section 3: Chart patterns
Lecture 6 Bullish Patterns & Bearish Patterns
Section 4: Technical Indicators
Lecture 7 Technical indicators most used in Swing trade
Lecture 8 Principle of bullish divergence and Bearich divergence
Section 5: Chart Trade and risk management
Lecture 9 point your buy and sell on the chart
Lecture 10 Search stocks for a Swing entry
Section 6: Short Sell
Lecture 11 Definition of short sell and short float
Lecture 12 Short Sell example
beginners in trading stocks
Screenshots
Homepage
without You and Your Support We Can’t Continue
Thanks for Buying Premium From My Links for Support
Click >>here & Visit My Blog Daily for More Udemy Tutorial. If You Need Update or Links Dead Don't Wait Just Pm Me or Leave Comment at This Post
Download from free file storage
Resolve the captcha to access the links!
Registered members don't get captcha ... just sayin