Chatgpt & Six Sigma: Certified Ai Visualization Proficient

Published 4/2024
MP4 | Video: h264, 1920x1080 | Audio: AAC, 44.1 KHz
Language: English | Size: 3.53 GB | Duration: 3h 54m
Master ChatGPT & Julius AI: Create Compelling Six Sigma Charts - White, Yellow Belt, Green Belt, Black Belt (Proficient)
What you'll learn
Apply ChatGPT & Julius AI to Construct Proficient-Level Six Sigma & Project Management Charts and Graphs
Deepen Analysis and Interpretation Skills with AI-Generated Visualizations
Enhance Data Visualization Prompt Design for AI Tools for Greater Clarity and Impact
Critically Evaluate AI Tools for Improved Six Sigma and Project Management Visualizations
Expand Development of Tailored Business Solutions Using Advanced AI-Enhanced Visualizations
Optimize Six Sigma and Project Management Projects with Strategic AI Tool Implementation
Elevate Report Creation and Presentation with Insightful AI-Enhanced Visualizations
Requirements
Students are required to complete Part 1 of this course: 'ChatGPT for Six Sigma Visualizations (Part 1)
Access to Premium (Paid) Versions of ChatGPT and Julius AI (Free versions do not provide capability to create charts and graphs covered in the course)
Basic Understanding of Six Sigma Methodology
Familiarity with Project Management Concepts
Basic Computer Skills and Internet Access
Basic Level of Data Literacy (including the ability to understand and manipulate data sets)
Beginner level Interest in AI and Data Science (Extensive expertise is NOT required)
Description
CHATGPT & SIX SIGMA: CERTIFIED AI VISUALIZATION PROFICIENTAre you looking to enhance your Six Sigma and Project Management skills with the power of AI? Look no further than the ChatGPT & Six Sigma: Certified AI Visualization Proficient Course, the second course in the ChatGPT & Six Sigma Charts Visualization Series by AIGPE. This unique program is designed to help you create professional-quality charts and graphs for your projects using two intelligent AI tools: ChatGPT and Julius AI.Whether you're a Six Sigma White Belt, Yellow Belt, Green Belt, Black Belt, or a Project Manager, CAPM, or PMP from any industry, this course is tailored to your needs. By leveraging the capabilities of ChatGPT and Julius AI, you can eliminate the need for statistical software like Minitab, SPSS, or Sigma XL, as well as visualization tools such as Power BI or Tableau.Building upon the foundation laid in Course 1: ChatGPT & Six Sigma: Certified AI Visualization Beginner (Level 1), this intermediate-level program (Level 2) delves deeper into the creation of more advanced charts and graphs. While the approach to using ChatGPT and Julius AI remains the same, you'll learn how to create intermediate-level visualizations such as Box Plots, Violin Plots, Pareto Charts, Lollipop Charts, Standard Area, and Stacked Area Charts.Elevate your career and make a positive impact on your salary by mastering the art of creating Six Sigma charts and graphs using ChatGPT and Julius AI. By enrolling in the ChatGPT & Six Sigma: Certified AI Visualization Proficient Course, you'll gain a competitive edge in your organization and set yourself apart from others by harnessing the power of artificial intelligence in your daily work and Six Sigma projects.This comprehensive program equips you with the proficiency to create six intermediate-level charts and graphs commonly used in Six Sigma White Belt, Six Sigma Yellow Belt, Six Sigma Green Belt, Six Sigma Black Belt, and regular project management projects. By the end of the course, you'll have expertise in using ChatGPT and Julius AI to visualize your data effectively.Not only will you gain valuable skills in crafting Six Sigma charts and graphs using cutting-edge AI tools, but you'll also have the opportunity to enhance your resume and stand out in today's competitive job market. The ChatGPT & Six Sigma: Certified AI Visualization course is more than just a learning experience; it's an investment in your professional growth and future success.Accessing Premium Versions of ChatGPT and Julius AITo unlock the full potential of AI-powered Six Sigma and Project Management chart creation, this course requires access to the premium versions of ChatGPT and Julius AI. While the free versions of these AI tools are powerful, they lack the advanced features necessary for generating the charts covered in this program. However, the cost of these premium AI tools is significantly lower than traditional software like Minitab, SPSS, Tableau, or Power BI, making them an economical choice for professionals seeking cutting-edge data visualization solutions. The course provides direct links to these AI tools, ensuring a seamless learning experience.What is ChatGPT?ChatGPT, developed by OpenAI, is a state-of-the-art artificial intelligence language model that excels in understanding and generating human-like text based on input prompts. By leveraging the power of deep learning and transformer architecture, ChatGPT can tackle a wide array of language tasks, from answering questions to producing creative content. In the realm of Six Sigma Visualization, ChatGPT serves as a valuable tool for data analysis, interpretation, and the creation of informative charts and graphs. Professionals looking to harness the potential of AI for enhanced data visualization and decision-making will find ChatGPT an indispensable asset.What is Julius AI?Julius AI is an innovative artificial intelligence tool designed to serve as a personal data analyst, simplifying the process of interpreting, analyzing, and visualizing structured data. With the ability to connect to various data sources, such as Excel and Google Sheets, Julius AI empowers users to create detailed data visualizations, including bar charts and heat maps, with ease. This tool is particularly beneficial for professionals who lack extensive data science expertise, as it streamlines data analysis and chart generation processes. By leveraging Julius AI, users can efficiently manage and visualize their data, making it a valuable resource for those seeking to capitalize on the power of AI in their work.What is Six Sigma?Six Sigma is a renowned methodology for process improvement that employs a data-driven approach and offers structured levels of expertise, such as Six Sigma White Belt, Six Sigma Yellow Belt, Six Sigma Green Belt, and Six Sigma Black Belt. Each level signifies a progressively deeper understanding and proficiency in applying Six Sigma principles. At the heart of this methodology lies the use of charts and graphs, including bar charts, scatter plots, pie charts, donut charts, and histograms. These visual tools are crucial for identifying process variations, analyzing root causes, and driving quality improvements. Regardless of your current Six Sigma expertise level, from a White Belt novice to a Black Belt expert, mastering these visual tools is essential for conducting effective analysis and making informed decisions in Six Sigma projects.Why Two AI Tools? A Dual Advantage in Learning:1. Stay Competitive with ChatGPT: In today's rapidly evolving professional landscape, mastering ChatGPT, a cutting-edge AI language model, is essential for staying relevant and ahead in your career. By honing your skills with ChatGPT, you'll enhance your ability to generate descriptive and textual output effectively, giving you a competitive edge in your field.2. Data Analysis Made Easy with Julius AI: Complementing the capabilities of ChatGPT is Julius AI, your personal data analyst. This powerful tool simplifies the creation of sophisticated charts and graphs, making data analysis accessible to everyone, regardless of their background in data science or coding. With Julius AI, you can easily visualize and interpret your data, enabling you to make data-driven decisions with confidence.3. Harness the Best of Both Worlds: By learning both ChatGPT and Julius AI, you'll gain a comprehensive skill set that empowers you to tackle a wide range of challenges:3.1 ChatGPT Proficiency: Become adept at prompt engineering and leverage ChatGPT's strengths in generating detailed textual analysis and highlights. This skill will enable you to communicate complex ideas effectively and create compelling narratives around your data.3.2 Julius AI Expertise: With Julius AI in your toolkit, you'll have an AI-powered data analysis tool specifically designed for intuitive use. You'll be able to converse with your data and visualize it effortlessly, allowing you to uncover meaningful insights and make informed decisions quickly.4. Join this Course to Gain a Competitive Edge: By enrolling in this course, you'll learn to harness the synergy of ChatGPT and Julius AI to elevate your Six Sigma and Project Management visualizations. This dual skill set not only enhances your capabilities but also sets you apart in your field, demonstrating your commitment to staying at the forefront of technology and data-driven decision-making.Don't miss this opportunity to step into the future of data visualization, where AI meets efficiency and creativity. Enroll now and gain the skills you need to succeed in today's data-driven world!Discover the Power of AI-Driven Visualizations in Six Sigma and Project ManagementAre you just starting your journey into data visualization for Six Sigma and Project Management? Look no further! This course is tailored specifically for beginners, providing step-by-step guidance to help you master the art of creating impactful charts and graphs using cutting-edge AI tools like ChatGPT and Julius AI.Throughout this course, you'll discover how to leverage these powerful AI technologies to generate a wide array of essential visualizations commonly used in Six Sigma and Project Management. Our comprehensive curriculum covers the following key chart and graph types:Throughout this course, you'll discover how to leverage these powerful AI technologies to generate a wide array of essential visualizations commonly used in Six Sigma and Project Management. Our comprehensive curriculum covers the following key chart and graph types:Box Plots: Discover the secrets to visually summarizing crucial aspects of data distribution, such as median, quartiles, and outliers, enabling you to effectively compare and contrast different datasets.Violin Plot: Immerse yourself in the world of data distribution and density estimation, harnessing the combined strengths of box plots and kernel density plots to gain a holistic understanding of your data's structure.Pareto Chart: Become a master at prioritizing factors within a dataset by learning how to seamlessly merge bars and line graphs, highlighting the most significant contributors to a cumulative effect.Lollipop Chart: Discover an engaging and visually appealing approach to presenting comparative data, leveraging the minimalist charm of combining the clarity of bar charts with the elegance of dot plots.Standard Area Chart: Dive into the art of quantitatively displaying the magnitude of change over time, emphasizing the total value across a trend by filling the area beneath the line.Stacked Area Chart: Gain valuable insights into breaking down data categories over time, enabling you to compare overall trends while simultaneously analyzing the relative sizes of each category.Each module in this course strikes a perfect balance between theory and practical application, ensuring that you can immediately apply your newly acquired skills to real-world Six Sigma and Project Management projects.Embark on this transformative learning experience and become a proficient creator of compelling visualizations that speak volumes. Don't wait – enroll now and unlock the power of AI to transform raw data into actionable insights that drive success!What will you achieve with this course?Start your transformative journey that will elevate your career to new heights by harnessing the power of AI in Six Sigma and Project Management:Master AI Driven Presentation Skills: Harness the power of AI-driven tools like ChatGPT and Julius AI to generate captivating visuals that effectively communicate your Six Sigma and project management findings to stakeholders and decision-makers.Simplify Data Analysis: Say goodbye to complex data science jargon and hello to AI-driven business data analysis that's accessible to everyone.Interpret with Confidence: Develop a keen eye for accurately interpreting data analysis results using the intuitive interfaces of ChatGPT and Julius AI.Tailor-Made Solutions: Discover the potential to generate personalized recommendations for even the most unique business challenges using AI's adaptive capabilities.Master the Art of Prompting: Become a prompt engineering expert, crafting precise and effective AI prompts that yield lightning-fast results.Bring Your Visuals to Life: Immerse yourself in the world of hands-on creation, learning to produce and download both static and interactive charts and graphs using AI tools.Ensure Consistent Accuracy: Discover proven techniques to safeguard against AI inaccuracies, guaranteeing consistently reliable data visualizations.Break Free from Complexity: Leave behind the complexities of tools like Tableau or Power BI and embrace the elegance of AI-powered data visualization.Immerse Yourself in Real-World Scenarios: Engage with practical exercises and case studies that mirror actual business situations, preparing you for real-life challenges.Learn from a Compelling Narrative: Follow a captivating real-life anecdote that unfolds from beginning to end, seamlessly incorporating all the charts you've learned throughout the course.Gain a Competitive Advantage: Differentiate yourself in the business world by adding ChatGPT and Julius AI proficiency to your professional skill set.Visualize with Impact: Become a master at creating meaningful and compelling charts and graphs that harness the power of AI to convey your message effectively.Conquer Any Business Challenge: Arm yourself with the analytical prowess of ChatGPT and Julius AI, enabling you to tackle any business issue head-on.Emerge as a Problem-Solving Powerhouse: Transform into a go-to resource in your business environment by developing exceptional problem-solving skills.Identify the Root of the Problem: Learn to identify root causes with pinpoint accuracy by interpreting AI-generated reports and graphs with newfound expertise.Access a Wealth of Knowledge: Dive into 4 hours of engaging content and a rich collection of downloadable resources designed to support your learning journey.Don't wait any longer – join the course now and embrace the future of Six Sigma and Project Management visualization with AI, where data and decisiveness converge to create unparalleled success.Who is this course: ChatGPT for Six Sigma Visualizations (Part 2) suitable for?If you're a professional or enthusiast involved in process improvement and quality management using Six Sigma methodologies, this course is designed with you in mind. It's also a great fit for Project Management Professionals and Data Analysts looking to expand their skill set. Here's a breakdown of who can benefit most from this course:Six Sigma Certified Individuals: Whether you hold a White, Yellow, Green, or Black Belt, this course will help you enhance your abilities with AI-driven data visualization tools.Project Managers: If you're managing projects where data analysis plays a crucial role, this course will teach you how to use AI tools for improved decision-making and reporting.Quality Control and Assurance Professionals: By learning to use AI for more effective data analysis and reporting, you can take your quality management skills to the next level.Data and Business Analysts: Looking to improve your data visualization skills? This course is perfect for you.Continuous Improvement Specialists: If you're focused on operational excellence and continuous process improvement, this course will show you how to incorporate advanced AI tools into your methods.AI and Data Science Enthusiasts: Curious about the intersection of AI, data science, process improvement methodologies like Six Sigma, and project management? This course is right up your alley.Even if you're a beginner in data science, this course will provide you with practical knowledge on using AI tools like ChatGPT and Julius AI for powerful data visualization in Six Sigma and Project Management projects.Are you ready to transform your approach to Six Sigma and Project Management with AI? This course is the perfect starting point for your journey into AI-powered data visualization. Take the first step towards elevating your professional expertise today!Elevate Your Career with AI-Driven Six Sigma and Project Management SkillsMastering the art of creating Six Sigma and Project Management charts and graphs using AI tools like ChatGPT and Julius AI is more than just learning new techniques - it's a transformative step in your professional journey. Here's how these skills can give your career a boost:Show Your Dedication: By acquiring these skills, you showcase your commitment to continuously improving your business intelligence and analytical capabilities.Demonstrate Your Forward-Thinking Mindset: Embracing AI tools for data analysis proves that you're dedicated to staying at the forefront of technological advancements.Contribute to Organizational Growth: Apply your newly acquired skills to drive your organization, business, or department towards increased success and efficiency.Earn Worldwide Recognition: The ability to generate Six Sigma charts and graphs using AI tools is highly regarded and sought after across various industries globally.Explore Diverse Opportunities: Whether you're in manufacturing or service-oriented sectors, these skills are in high demand worldwide, opening up a wide range of career prospects.Revolutionize your professional path by harnessing the combined power of AI and Six Sigma. Take the first step towards future-proofing your career by enrolling in this course today.Who should not enroll in this course?While this course is tailored for beginners, it may not be the ideal choice for everyone. Here are a few groups who might find the content less relevant to their needs:Seasoned Data Scientists and Statisticians: If you already have a wealth of experience in advanced data analysis, statistical modeling, and complex visualization techniques, you may find the material in this course too simplistic.Those Seeking In-Depth Six Sigma Training: If your primary goal is to dive deep into Six Sigma methodologies and tools beyond basic visualization and AI applications, this course may not provide the level of detail you're looking for.AI and Machine Learning Specialists: For professionals or researchers who specialize in artificial intelligence and machine learning and are already skilled in data visualization, this course may not offer much in the way of new or challenging information.Individuals Focused on Non-Visual Six Sigma Tools: If your interests lie exclusively in other aspects of Six Sigma that don't involve data visualization, such as process optimization or lean management practices, this course may not be the best fit.Learners Seeking Extensive Hands-On Coding Experience: While this course focuses on using AI tools for visualization, it doesn't delve deeply into coding or algorithmic details. If your primary goal is to enhance your programming skills in data science, you may want to explore other options.This course is designed to cater to those who are just starting their journey in data visualization within the context of Six Sigma and Project Management. It may not meet the needs of advanced practitioners or those seeking in-depth training in other specific areas.If you're ready to embark on your AI-powered journey in Six Sigma and Project Management visualization, join us now and discover the potential of data analysis on this enlightening path.Why This Course is Right for You?Do any of these challenges sound familiar?Balancing Work and Learning: Struggling to find time for professional development in your hectic work schedule? This course is designed for efficient learning, allowing you to upskill without sacrificing your work commitments.Immediately Applicable Skills: Seeking skills that you can put into practice right away? This course focuses on practical applications that you can integrate into your current projects from day one.Balancing Theory and Practice: Looking for a course that offers a balance of theoretical knowledge and hands-on experience? This course provides a harmonious blend of both, with a special focus on Six Sigma and Project Management projects.Simplifying Data Science: Feeling intimidated by complex data science concepts? We break down these concepts into easily understandable lessons, perfect for those without a data science background.Six Sigma and Project Management Specific Tools: Searching for tools that directly apply to your Six Sigma and Project Management needs? This course is tailored to using AI specifically for Six Sigma and Project Management methodologies.Self-Paced Learning: Concerned about keeping up with a rigid course schedule? Our flexible course structure allows you to learn at your own pace, ensuring a stress-free learning experience.Tackling Real-World Challenges: Eager to apply your learning to real-world situations? This course engages you with case studies and scenarios that closely resemble the challenges you encounter in your own projects.Join us today and revolutionize your approach to Six Sigma projects with the power of AI.Why You Should Enroll?Revolutionize Your Data Analysis Skills:Boost Efficiency: Become proficient in AI tools (ChatGPT and Julius AI) to streamline your data analysis processes, making them quicker and more precise, ultimately saving time and resources.Design Powerful Visualizations: Acquire the skills to create clearer, more compelling visualizations that make complex data easy to understand and engage with.Propel Your Career Forward:Continuous Professional Development: Whether you're aiming for higher Six Sigma belts or PMP certification, this course supports your continuous learning journey to excel in process improvement, quality, and project management.Uncover Hidden Insights: Learn how AI uncovers patterns and trends that traditional methods often overlook, enabling you to approach problem-solving in innovative ways.Acquire Practical Skills for Real-World Application:Apply Skills in Business Contexts: Immediately apply your newly acquired AI knowledge to real-world scenarios, witnessing the practical benefits in your daily work.Stay Ahead of the Technology Curve: Arm yourself with cutting-edge AI skills that are essential in today's rapidly evolving technological landscape.Connect Theory with Practice:From Understanding to Application: Move beyond theoretical knowledge and learn how to apply AI to create charts and graphs that directly contribute to your daily professional responsibilities.Enhance Data Literacy: Strengthen your ability to make data-driven decisions, increasing your value in your current role and within your organization.If you're ready to take your Six Sigma and Project Management expertise to new heights with AI, join us on this transformative learning journey.What You Can Expect from This Course?Embark on a transformative journey to master AI in Six Sigma and Project Management visualizations. Here's what you can expect from this course:Step-by-Step Guidance: Receive clear, straightforward instructions on utilizing ChatGPT and Julius AI for data visualization in Six Sigma and Project Management contexts.Real-World Scenarios: Engage with practical examples and case studies to gain a hands-on understanding of how to apply your new skills in real-life situations.Interactive Learning: Participate in interactive models and exercises to practice your newly acquired skills in a hands-on manner.Comprehensive Tutorials: Access detailed video tutorials that guide you through the process of creating various charts and graphs, ensuring you can effectively apply these skills in your projects.Adaptable Visualization Prompts: Utilize customizable AI-prompts for a wide range of data visualizations to accommodate your specific project requirements.Collaborative Community: Connect with a community of learners through the Q&A discussion board, fostering knowledge sharing, collaboration, and peer support.Current Industry Insights: Stay informed about the latest trends and developments in AI and data visualization within the context of Six Sigma and Project Management.Self-Paced Learning: Benefit from the flexibility to learn at your own pace with round-the-clock access to course materials.If you're ready to revolutionize your approach to data visualization in Six Sigma and Project Management, enroll now and add AI-powered proficiency to your skill set!Elevate Your Career with AI-Powered Six Sigma and Project Management ExpertiseThe ChatGPT and Six Sigma: Certified AI Visualization Proficient course is more than just a learning experience. It's a pathway to propel your career forward, strengthen your analytical skills, and keep you at the cutting edge of technological advancements in process improvement and project management. By incorporating AI tools like ChatGPT and Julius AI into your skill set, you not only enhance your professional qualifications but also establish yourself as an innovative problem-solver in your field.Who is This Course Ideal For?Six Sigma practitioners aiming to incorporate AI into their workflow (including White Belt, Yellow Belt, Green Belt, Black Belt, and Master Black Belt Certification holders, as well as those without formal certification).Project Managers looking to improve decision-making through data visualization (CAPM, PMP, and Prince 2 Certified professionals, as well as those without formal certification).Data analysts and business analysts seeking to enhance their visualization capabilities.Continuous improvement specialists interested in exploring cutting-edge AI tools.AI and data science enthusiasts eager to apply their knowledge in real-world business scenarios.Enroll Now and Start Your AI Journey!Don't let this chance to participate in a groundbreaking learning experience that combines Six Sigma and Project Management expertise with the power of AI pass you by. Whether your goal is to advance your career, improve your project results, or differentiate yourself in a competitive job market, this course is the catalyst you need to achieve your objectives.Join us today and take the first step towards mastering AI-driven data visualization in Six Sigma and Project Management. Click the Enroll button now and prepare to shape the future of business intelligence!
Overview
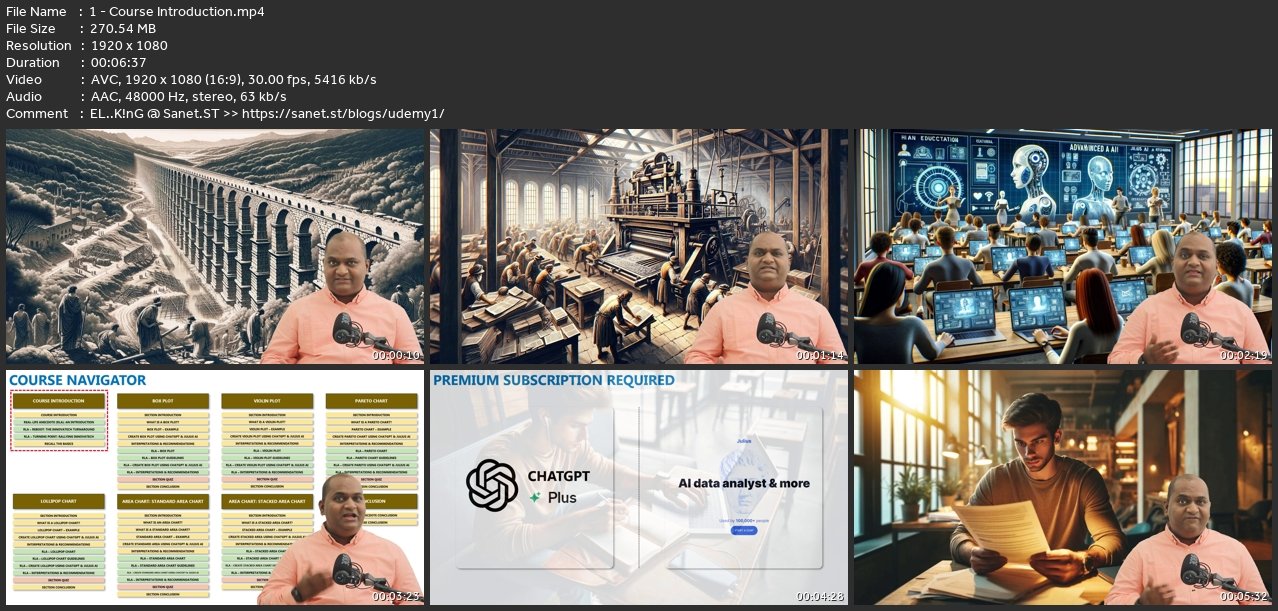
Section 1: Course Introduction
Lecture 1 Course Introduction
Lecture 2 Real-Life Anecdote - An Introduction
Lecture 3 Reboot: The Innovatech Turnaround
Lecture 4 The Turning Point: Rallying Innovatech
Lecture 5 Recall the Basics
Section 2: Create Box Plots using ChatGPT and Julius AI
Lecture 6 Section Introduction
Lecture 7 What is a Box Plot?
Lecture 8 Box Plot - Example (Business Case)
Lecture 9 Creating a Box Plot using ChatGPT
Lecture 10 Creating a Box Plot using Julius AI
Lecture 11 Box Plot Example - Interpretations and Recommendations
Lecture 12 Real-Life Anecdote: A Journey into Box Plots and Process Improvement
Lecture 13 Real-Life Anecdote: Empowering You (Innovators): Using ChatGPT and Julius AI to
Lecture 14 Real-Life Anecdote: Creating a BoxPlot using ChatGPT
Lecture 15 Real-Life Anecdote: Creating a BoxPlot using Julius AI
Lecture 16 Real-Life Anecdote: Interpretations and Recommendations (Box Plot)
Lecture 17 Section Conclusion
Section 3: Create Violin Plots using ChatGPT and Julius AI
Lecture 18 Section Introduction
Lecture 19 What is a Violin Plot?
Lecture 20 Violin Plot - Example (Business Case)
Lecture 21 Creating a Violin Plot using ChatGPT
Lecture 22 Creating a Violin Plot using Julius AI
Lecture 23 Violin Plot Example - Interpretations and Recommendations
Lecture 24 Real-Life Anecdote: Exploring Employee Engagement with AI and Violin Plot
Lecture 25 Real-Life Anecdote: Empowering You (Innovators): Using ChatGPT and Julius AI to
Lecture 26 Real-Life Anecdote: Creating a Violin Plot using ChatGPT
Lecture 27 Real-Life Anecdote: Creating a Violin Plot using Julius AI
Lecture 28 Real-Life Anecdote: Interpretations and Recommendations (Violin Plot)
Lecture 29 Section Conclusion
Section 4: Create Pareto Charts using ChatGPT and Julius AI
Lecture 30 Section Introduction
Lecture 31 What is a Pareto Chart?
Lecture 32 Pareto Chart - Example (Business Case)
Lecture 33 Creating a Pareto Chart using ChatGPT
Lecture 34 Creating a Pareto Chart using Julius AI
Lecture 35 Pareto Chart Example - Interpretations and Recommendations
Lecture 36 Real-Life Anecdote: Navigating High Expenses with Pareto Charts and AI
Lecture 37 Real-Life Anecdote: Empowering You (Innovators): Using ChatGPT and Julius AI to
Lecture 38 Real-Life Anecdote: Creating a Pareto Chart using ChatGPT
Lecture 39 Real-Life Anecdote: Creating a Pareto Chart using Julius AI
Lecture 40 Real-Life Anecdote: Interpretations and Recommendations (Pareto Chart)
Lecture 41 Section Conclusion
Section 5: Create Lollipop Charts using ChatGPT and Julius AI
Lecture 42 Section Introduction
Lecture 43 What is a Lollipop Chart?
Lecture 44 Lollipop Chart - Example (Business Case)
Lecture 45 Creating a Lollipop Chart using ChatGPT
Lecture 46 Creating a Lollipop Chart using Julius AI
Lecture 47 Lollipop Chart Example - Interpretations and Recommendations
Lecture 48 Real-Life Anecdote: The Art of IT Support with Lollipop Charts using AI
Lecture 49 Real-Life Anecdote: Empowering You (Innovators): Using ChatGPT and Julius AI to
Lecture 50 Real-Life Anecdote: Creating a Lollipop Chart using ChatGPT
Lecture 51 Real-Life Anecdote: Creating a Lollipop Chart using Julius AI
Lecture 52 Real-Life Anecdote: Interpretations and Recommendations (Lollipop Chart)
Lecture 53 Section Conclusion
Section 6: Create Standard Area Chart using ChatGPT and Julius AI
Lecture 54 Section Introduction
Lecture 55 What is a Standard Area Chart?
Lecture 56 Standard Area Chart - Example (Business Case)
Lecture 57 Creating a Standard Area Chart using ChatGPT
Lecture 58 Creating a Standard Area Chart using Julius AI
Lecture 59 Standard Area Chart Example - Interpretations and Recommendations
Lecture 60 Real-Life Anecdote: Analyzing Marketing ROI with the Standard Area Chart
Lecture 61 Real-Life Anecdote: Empowering You (Innovators): Using ChatGPT and Julius AI to
Lecture 62 Real-Life Anecdote: Creating a Standard Area Chart using ChatGPT
Lecture 63 Real-Life Anecdote: Creating a Standard Area Chart using Julius AI
Lecture 64 Real-Life Anecdote: Interpretations and Recommendations (Standard Area Chart)
Lecture 65 Section Conclusion
Section 7: Create Stacked Area Chart using ChatGPT and Julius AI
Lecture 66 Section Introduction
Lecture 67 What is a Stacked Area Chart?
Lecture 68 Stacked Area Chart - Example (Business Case)
Lecture 69 Creating a Stacked Area Chart using ChatGPT
Lecture 70 Creating a Stacked Area Chart using Julius AI
Lecture 71 Stacked Area Chart Example - Interpretations and Recommendations
Lecture 72 Real-Life Anecdote: Exploring the Stacked Area Chart’s Insights
Lecture 73 Real-Life Anecdote: Empowering You (Innovators): Using ChatGPT and Julius AI to
Lecture 74 Real-Life Anecdote: Creating a Stacked Area Chart using ChatGPT
Lecture 75 Real-Life Anecdote: Creating a Stacked Area Chart using Julius AI
Lecture 76 Real-Life Anecdote: Interpretations and Recommendations (Stacked Area Chart)
Lecture 77 Section Conclusion
Section 8: Course Conclusion
Lecture 78 Real-Life Anecdote Conclusion
Lecture 79 Course Conclusion
Six Sigma Practitioners (White Belt, Yellow Belt, Green Belt, Black Belt, Master Black Belt, Non-Six Sigma Certified Professionals): Seeking to deepen their integration of AI into data visualization and analysis, moving beyond basic tools to more sophisticated, AI-driven techniques for impactful insights.
Screenshots
Homepage
without You and Your Support We Can’t Continue
Thanks for Buying Premium From My Links for Support
Click >>here & Visit My Blog Daily for More Udemy Tutorial. If You Need Update or Links Dead Don't Wait Just Pm Me or Leave Comment at This Post
Download from free file storage
Resolve the captcha to access the links!
Registered members don't get captcha ... just sayin