Tableau Tutorial for Beginners (2022)

Last updated 11/2022
Duration: 6h 39m | Video: .MP4, 1280x720 30 fps | Audio: AAC, 48 kHz, 2ch | Size: 2.66 GB
Genre: eLearning | Language: English[Auto]
Master Tableau and Create Beautiful Data Visualizations with These Beginner-Friendly Lessons
What you'll learn
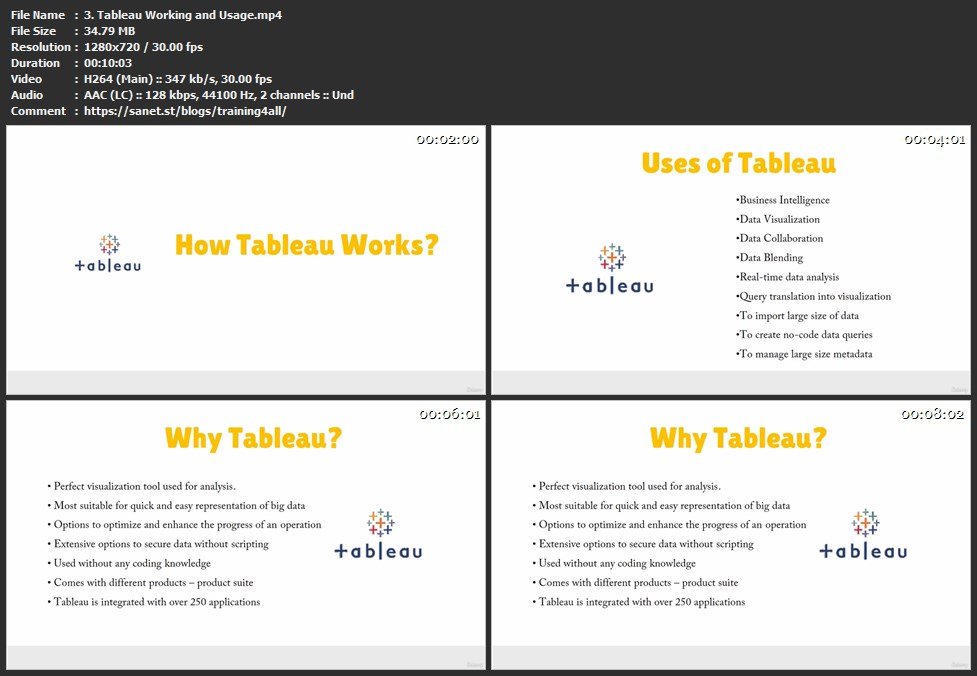
How to get started with Tableau
The different types of Tableau products and how to use them
How to download and install Tableau Desktop
How to import and extract data in Tableau
The basics of the Tableau interface and how to build custom visualizations
Advanced Tableau techniques like creating dual axis charts, hierarchies, groups, and parameters
How to create and use sets, work with calculations, and publish and share reports in Tableau
How to create various types of charts and maps in Tableau, including pie charts, scatter plots, packed bubble charts, and filled maps
How to create animated data visualizations and apply conditional formatting in Tableau
How to use Tableau for data science, including cluster analysis and linear regression modeling using the Iris dataset
Requirements
Basic knowledge of data analysis and visualization
Familiarity with the Windows, Mac, or Ubuntu operating system
Description
Welcome to "Tableau Tutorial for Beginners"! In this course, you will learn everything you need to know to get started with Tableau.
We will begin by introducing you to the different types of Tableau products and how they can be used. You will then learn how to download and install Tableau Desktop, and how to import data into the software.
Next, we will cover the basics of the Tableau interface, and show you how to build custom visualizations. We will also delve into advanced topics like creating dual axis charts, hierarchies, groups, and parameters.
You will learn how to create and use sets, as well as how to work with calculations in Tableau. We will also teach you how to publish and share your reports (dashboards) with others.
In addition, we will show you how to create various types of charts and maps in Tableau, such as pie charts, scatter plots, packed bubble charts, and filled maps. We will also teach you how to create animated data visualizations and apply conditional formatting to your data.
Finally, we will demonstrate how to use Tableau for data science by walking you through a cluster analysis and linear regression model using the Iris dataset.
By the end of this course, you will have a solid foundation in Tableau and be able to confidently create powerful and interactive data visualizations.
Who this course is for
Data analysts, data scientists, or business intelligence professionals who want to learn how to use Tableau
Anyone interested in creating interactive and visually appealing data visualizations
Students or professionals who want to learn how to use Tableau for data science and machine learning applications
Homepage
Screenshots
Download from free file storage
Resolve the captcha to access the links!
Registered members don't get captcha ... just sayin