Data-Driven Presentations with Excel and PowerPoint (365/2019)
This post was published 3 years ago. Download links are most likely obsolete. If that's the case, try asking the uploader to re-upload.

Duration: 1h 45m | MP4 | Video: AVC, 1280x720 30 fps | Audio: AAC, 48 KHz, 2 Ch | Size: 392 MB
Skill Level: Intermediate | Genre: eLearning | Language: English + Subtitles
Learn how to create high-impact, data-rich presentations using PowerPoint and Excel together. Follow along with Gini von Courter as she shows how to create presentations that are easy to use, easy to understand, and—best of all—easy to update. It all starts in Excel. Gini begins with an example spreadsheet featuring typical business data. She uses conditional formatting to highlight important information, PivotTables to summarize data, and sparklines and charts to create illustrations. She also shows how to use several different methods, including copying and pasting, linking, and embedding, to import your work into PowerPoint. She then demonstrates how to use PowerPoint animation features to animate Excel charts and tables and focus the viewer's attention. If you've wondered how to create expressive but low-maintenance presentations to showcase your data—no matter how often it changes—this course is for you.
Topics include:
Copying and pasting content
Linking and embedding data and objects
Formatting Excel data
Building an infographic
Illustrating trends with sparklines
Highlighting data with conditional formatting
Summarizing data with PivotTables and PivotCharts
Finalizing your presentation in PowerPoint
Animating charts and tables
Homepage
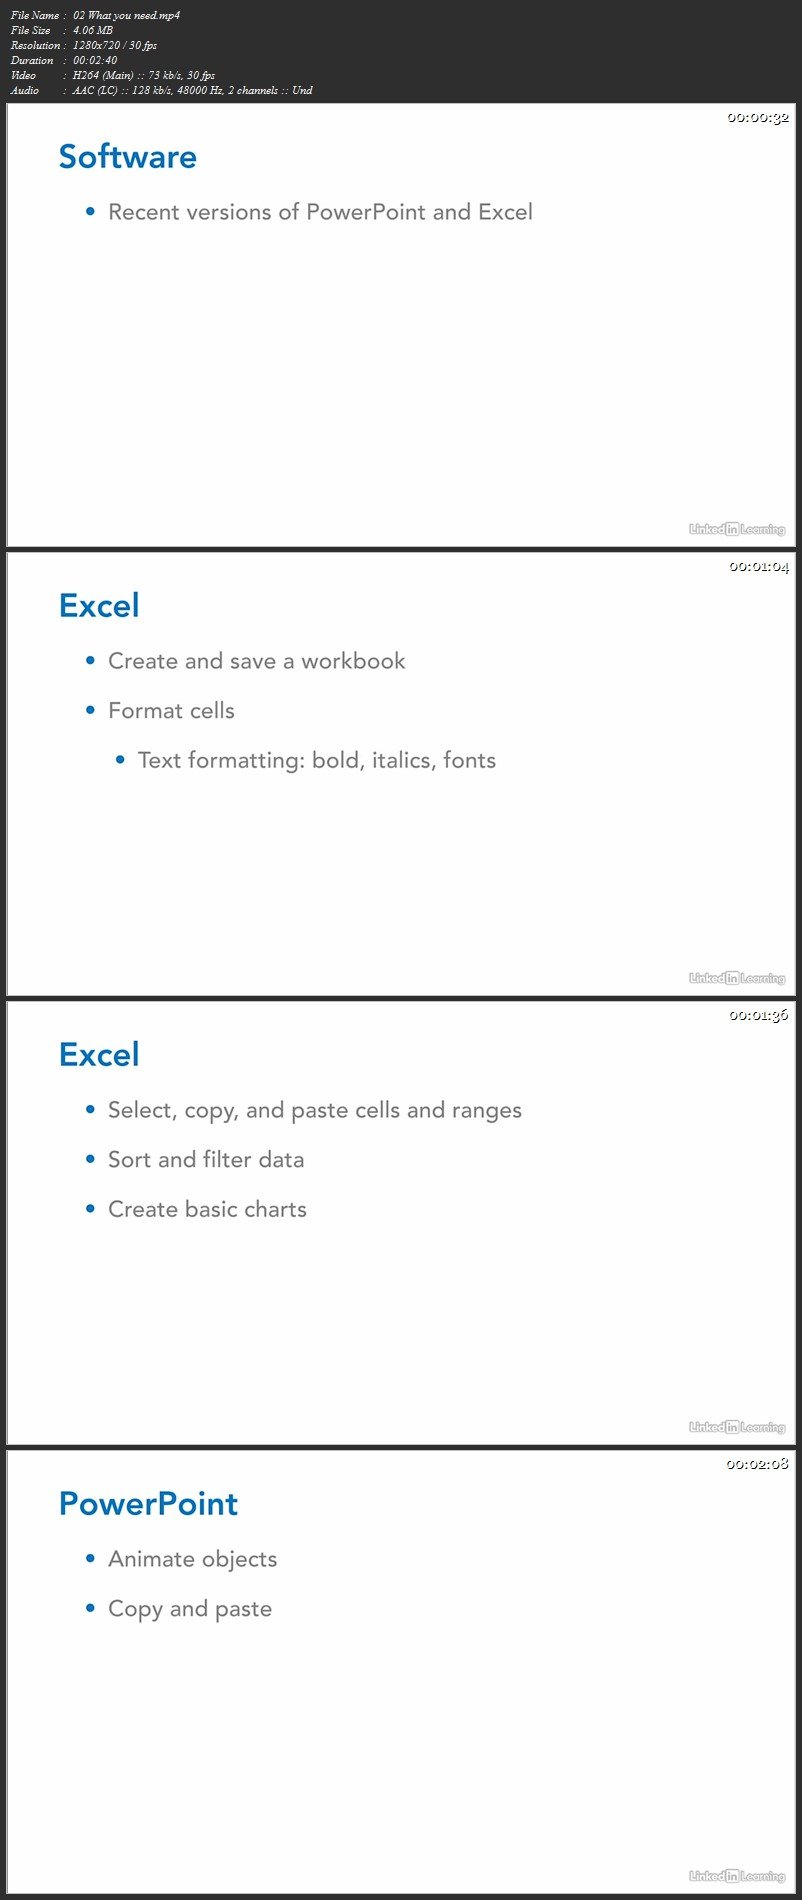
Screenshots
Download from free file storage
Resolve the captcha to access the links!
Registered members don't get captcha ... just sayin