Data Analysis and Visualization with R for beginners


Instructors: Bluelime Learning Solutions
2 sections • 28 lectures • 1h 59m total length
Video: MP4 1280x720 44 KHz | English + Sub
Updated 2/2023 | Size: 734 MB
Data exploration and Visualization using R
What you'll learn
Install R and RStudio
Create new R Projects
Create R variables (objects)
Install and load R Packages
Import data into R Studio
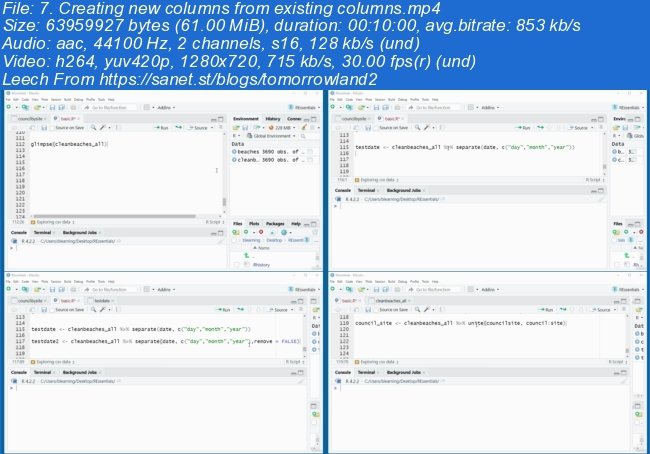
Perform data wrangling on your data
Pipe several functions into a dataset using the Pipe function
Create data visualizations using graphs
Read data into a variable
Requirements
R and R Studio installation required. (This is covered in the course)
Description
R is a programming language. R is often used for statistical computing and graphical presentation to analyse and visualize data.
R provides a wide variety of statistical (linear and nonlinear modelling, classical statistical tests, time-series analysis, classification, clustering, …) and graphical techniques, and is highly extensible.
One of R’s strengths is the ease with which well-designed publication-quality plots can be produced, including mathematical symbols and formulae where needed.
R is available as Free Software under the terms of the Free Software Foundation’s GNU General Public License in source code form. It compiles and runs on a wide variety of UNIX platforms and similar systems (including FreeBSD and Linux), Windows and MacOS.
R is an integrated suite of software facilities for data manipulation, calculation and graphical display. It includes
an effective data handling and storage facility,
a suite of operators for calculations on arrays, in particular matrices,
a large, coherent, integrated collection of intermediate tools for data analysis,
graphical facilities for data analysis and display either on-screen or on hardcopy, and
a well-developed, simple and effective programming language which includes conditionals, loops, user-defined recursive functions and input and output facilities.
R can be extended (easily) via packages. There are about eight packages supplied with the R distribution and many more are available through the CRAN family of Internet sites covering a very wide range of modern statistics.
RStudio is an integrated development environment for R, a programming language for statistical computing and graphics. It is available in two formats: RStudio Desktop is a regular desktop application while RStudio Server runs on a remote server and allows accessing RStudio using a web browser.
Who this course is for
Beginners to data analysis and visualization using R
Homepage
Screenshots
~~~~ Welcome to my Blogs ~~~~
Do not forget to check it every day!
If You should find any files not found, please PM me~Download Download: Best Software for All
~Tomorrowland2: Video Training
~Pluralsight Tutorials: All Pluralsight Videos
~EbookSA: Best Ebooks
~Graphic World: Best Graphics
Download from free file storage
Resolve the captcha to access the links!
Registered members don't get captcha ... just sayin