How to Visualize Data with R
This post was published 2 years ago. Download links are most likely obsolete. If that's the case, try asking the uploader to re-upload.
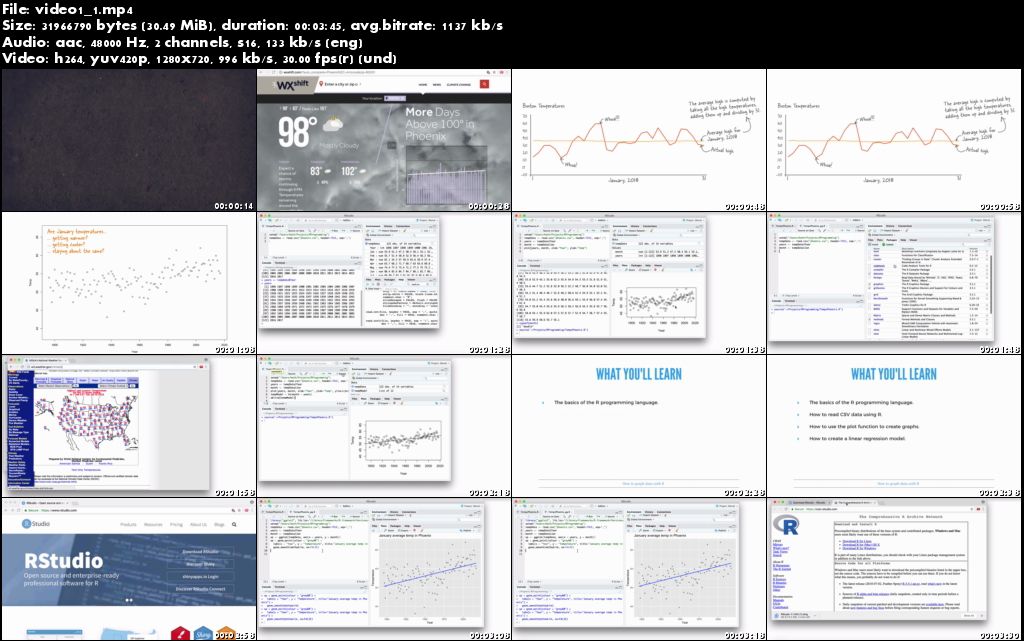
h264, yuv420p, 1280x720 | ENGLISH, 48000 Hz, 2channel | 1h 27mn | 708.4 MB
Welcome to How to Visualize Data with R. In this course, You’ll learn how to use the R programming language and RStudio to visualize data. Elisabeth will take you through building a visualization using data downloaded from the US National Weather Service. You’ll learn how to use R to read data from a CSV file, inspect and understand data and data frames, and use the plot() and ggplot() functions to create data visualizations. Along the way, you’ll learn from the ground up how to use R and RStudio, including how to create and run an R script, basic R data types and values, how to create a scatter plot graph, how linear regression works, and how to install and use an R package.
At the end of the course, you’ll have completed a data visualization of the weather data and have some new skills you can apply to your own data too.
Screenshots
Download from free file storage
Resolve the captcha to access the links!
Registered members don't get captcha ... just sayin