Data Story Telling
This post was published 3 years ago. Download links are most likely obsolete. If that's the case, try asking the uploader to re-upload.
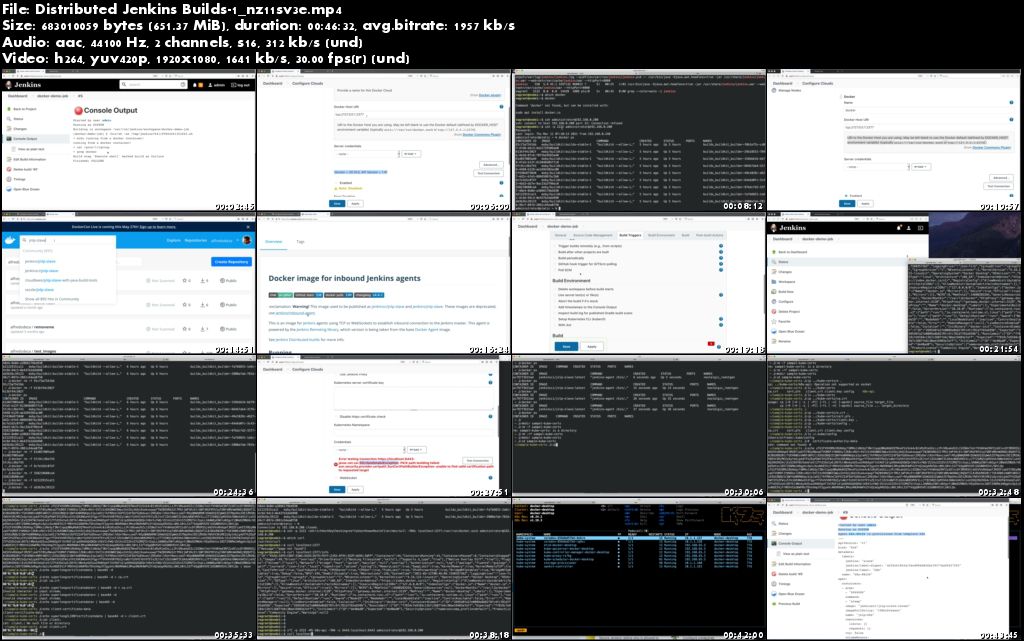
h264, yuv420p, 1920x1080 | ENGLISH, 44100 Hz, 2channels | 1h 15mn | 1.35 GB
Learn to tell stories with Data and then present those conclusions to Business Executives.
Learn to use Colab/Jupyter Notebooks to build Data Science notebooks that tell a story.
Topics include:
* Effects of Intermittent Fasting, Sugar, Wealth and Real Estate Values on society
* Visualizing data through Plotly graphs with 3D Interactive Visualizations of KMeans clustering
* Using sklearn, pandas, plotly, matplotlib, KMeans clustering, ELI5, shap and other libraries
* The role of the Matthew Effect on society. The Github Project is here:https://github.com/noahgift/data-story-telling
Screenshots
Download from free file storage
Resolve the captcha to access the links!
Registered members don't get captcha ... just sayin