Basics of Statistics - Part 1
This post was published 2 years ago. Download links are most likely obsolete. If that's the case, try asking the uploader to re-upload.


Instructors: Management Study Guide
1 section • 10 lectures • 29m total length
Video: MP4 1280x720 44 KHz | English + Sub
Updated 9/2018 | Size: 352 MB
It is crucial that you have a good grasp of statistics to succeed in the corporate world.
What you'll learn
Explain What is Statistics
Describe the Uses of Statistics
Explain the Types of Variables
Explain the Major Sources of Data
Explain the Key Terms of Statistics
Explain the Steps for Presentation of Data
Explain the Various Measures of Central Tendency
Explain the Methods of Graphical Presentation of Data
Explain What is a Frequency Distribution Table
Explain What is Probability
Explain What is Combination
Explain What is Permutation
Explain What is Variance
Explain What is Standard Deviation
Describe the Types of Discrete Distributions
Requirements
No prior knowledge is necessary.
Description
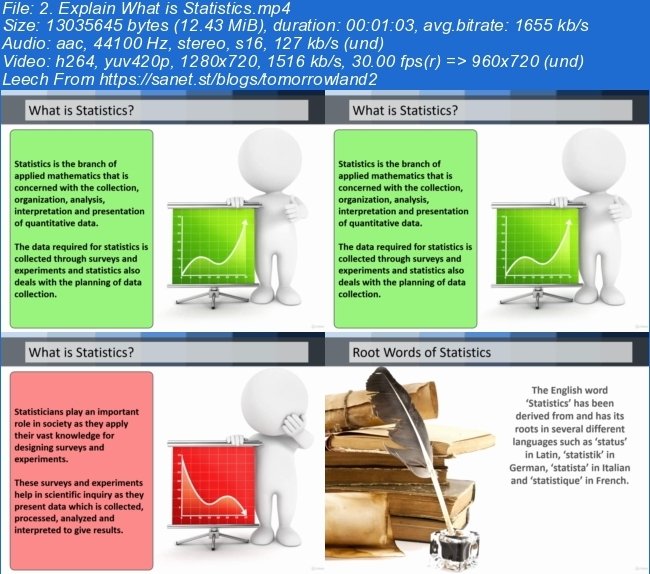
Statistics is the branch of applied mathematics that is concerned with the collection, organization, analysis, interpretation and presentation of quantitative data. The data required for statistics is collected through surveys and experiments and statistics also deals with the planning of data collection. Statisticians play an important role in society as they apply their vast knowledge for designing surveys and experiments. These surveys and experiments help in scientific inquiry as they present data which is collected, processed, analyzed and interpreted to give results.
The English word ‘Statistics’ has been derived from and has its roots in several different languages such as ‘status’ in Latin, ‘statistik’ in German, ‘statista’ in Italian and ‘statistique’ in French. A ‘Variable’ is a quantity that can assume any of a set of values. It is generally represented by using a symbol such as ‘x’ or ‘y’. Such symbols are widely used in mathematical or logical expressions to represent a variable quantity.
‘Qualitative variables’ have non-numeric outcomes and involve distinctions based on qualities that are used to identify categories of items with no natural ordering. ‘Quantitative variables’ have numeric outcomes and are expressible as a quantity and indicate how much and how many? ‘Discrete Random Variables’ have numerical outcomes which can be only a certain number of possible values, usually integers. However, it is not always necessary that these possible values are always integers.
‘Primary Data’ is the data that is collected for the first time during the research. ‘Secondary Data’ is the data which is already available and published data that had been collected for some other purpose, but can be used for the present research also.
Random Sample
‘Random Sample’ is a sub-set of a population in which all members of the population are equally likely to be selected for inclusion in the sample. This helps to make sure that the sample is representative of the whole population.
Who this course is for
This course is good for management learners and people who want to learn about Basics of Statistics
Screenshots
~~~~ Welcome to my Blogs ~~~~
Do not forget to check it every day!
If You should find any files not found, please PM me~Download Download: Best Software for All
~Tomorrowland2: Video Training
~Pluralsight Tutorials: All Pluralsight Videos
~EbookSA: Best Ebooks
~Graphic World: Best Graphics
Download from free file storage
Resolve the captcha to access the links!
Registered members don't get captcha ... just sayin